天软金融分析.NET函数大全 > Web开发支撑 > .Web Tools > 图形 > 绘图接口
注意:如果数值窗口 遮挡,可以 设为浮点,任意放大,再固定,即可(2026-04-09 xqx 应为bug.)
增加右侧展示字段后,首图会缺失一个图例 (2026-04-13 xqx 应为bug.)
tssubplot_lines
简述
时序数据多子图折线图批量绘制函数,按分组配置自动生成多组折线子图,自动处理时间格式化、数据列重命名、信息列合并,适用于多指标可视化对比
注意:如果数值窗口 遮挡,可以 设为浮点,任意放大,再固定,即可(2026-04-09 xqx 应为bug.)
增加右侧展示字段后,首图会缺失一个图例 (2026-04-13 xqx 应为bug.)
定义
tssubplot_lines(data:Integer;fname_subplots:Integer;fname_date:Integer;fname_infos:Integer;dict_Indicator:Integer):array;
参数
| 名称 | 类型 | 说明 |
|---|---|---|
| data | Integer | 整数, |
| fname_subplots | Integer | 整数, |
| fname_date | Integer | 整数, |
| fname_infos | Integer | 整数, |
| dict_Indicator | Integer | 整数,Metrics概览指标 |
| 返回 | array | array, gsubplot:封装完成的多分组子图图形数组,支持直接渲染展示 |
- 范例t := fi_report_ExcessYields(TSUT_Data_ZSZF(),"沪深300","中证500");
return tssubplot_lines(t,
array(
'累计':("沪深300->累计","中证500->累计",),
('累计超额(%)',"超额(%)->累计" ),
("沪深300_回撤(%)","中证500_回撤(%)",),
('超额_回撤(%)','超额_回撤2(%)'),
('相对净值')
),
'截止日',
array('超额(%)',"沪深300", "中证500"),
array('夏普':3,'累计收益':3)
);
//结果: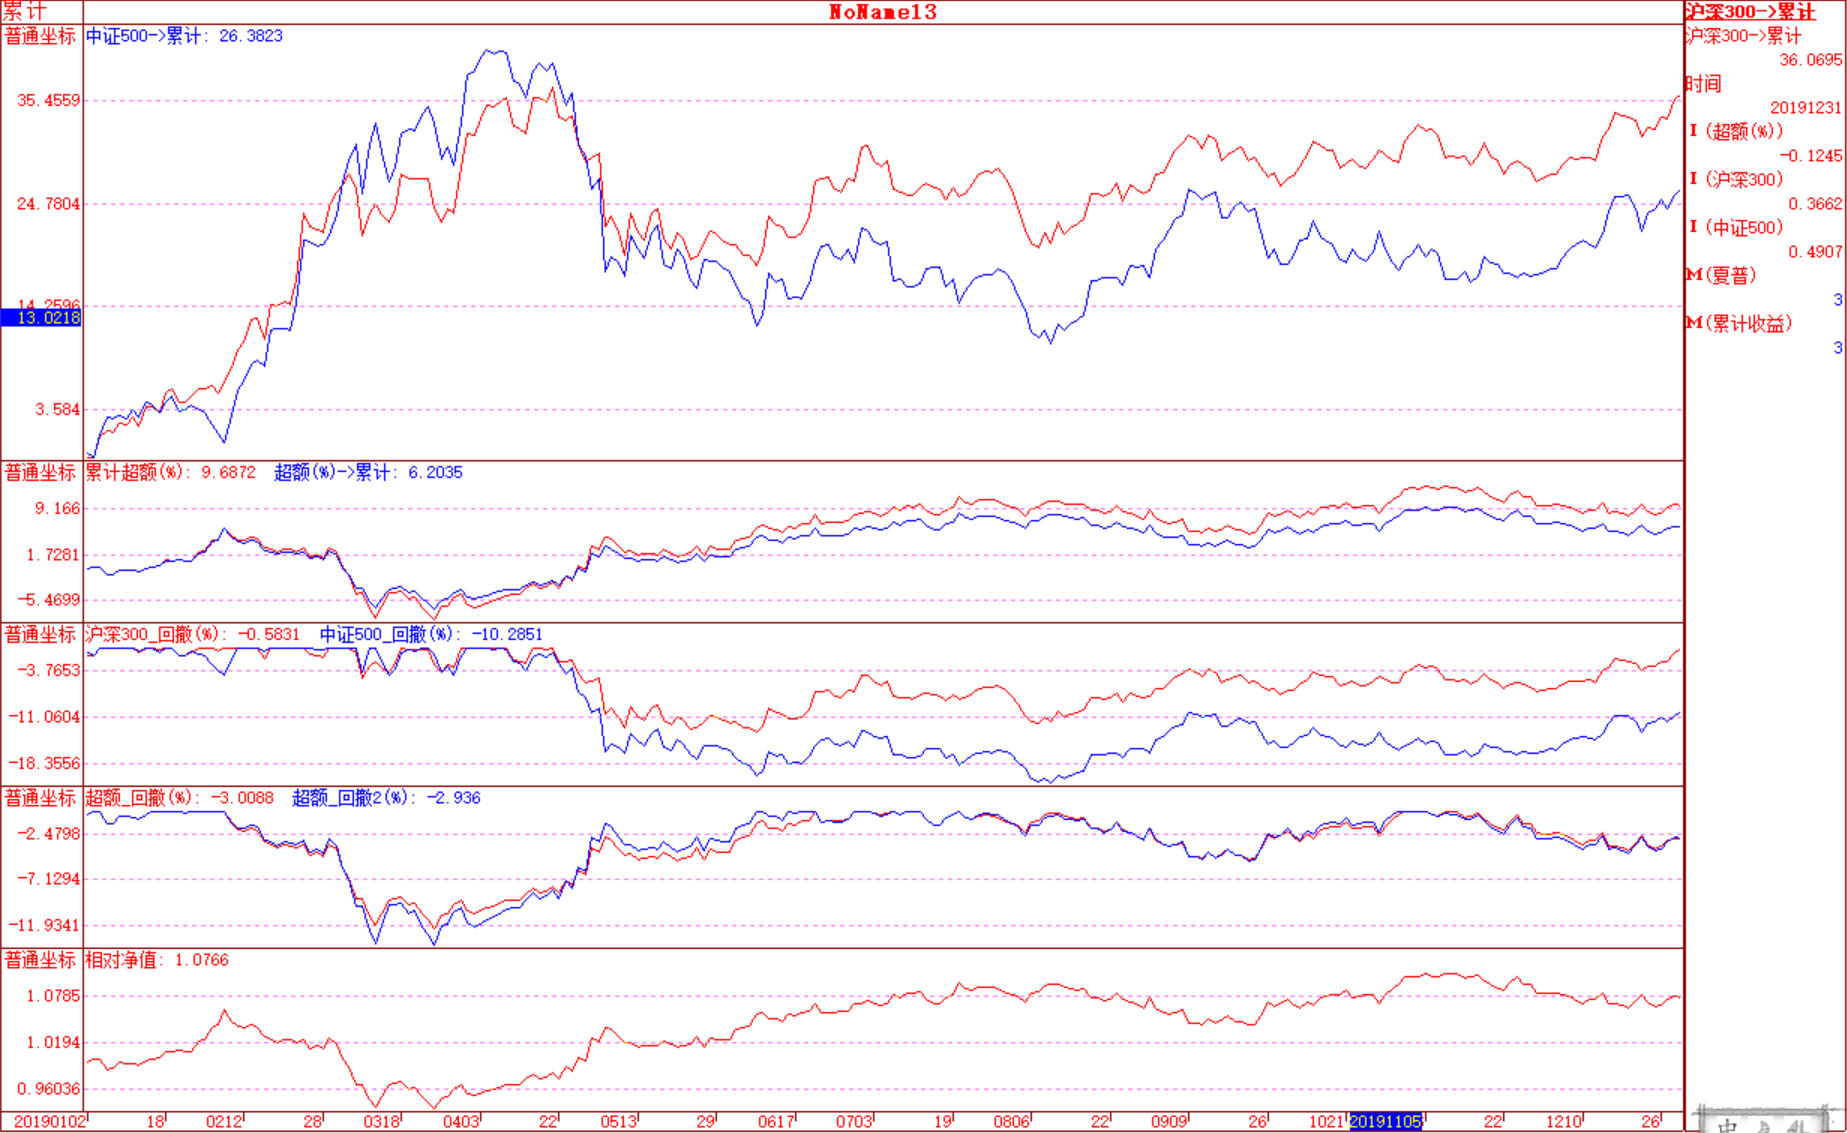
相关